120 CAG R6/2 Mouse Model of Huntington’s Disease
Huntington’s disease (HD) is an incurable neurodegenerative disease characterized by abnormal motor movements, personality changes and early death. The disease typically starts in midlife and symptoms progress over the course of 15–20 years until death. The mutation responsible for HD is an unstable expansion of CAG repeats in the gene encoding for the huntingtin (Htt) protein, giving rise to an abnormal number of glutamine repeats, which accumulate and form aggregates in the nucleus. These aggregates, called inclusion bodies (IBs), are the pathological hallmark of HD.
In collaboration with the CHDI Foundation, we employed molecular, behavioral, histological, and electrophysiological approaches to characterize the R6/2 HD mouse model, expressing the N-terminal (exon 1) portion of huntingtin with an expansion of approximately 120 CAG repeats, at both pre- and post-symptomatic ages. We have recapitulated some aspect of HD in humans including neuronal loss, Htt aggregation and inclusion bodies, motor decline and cognition impairment, deficits in synaptic transmission and plasticity, changes in expression of disease markers, and altered kynurenine pathway. 120 CAG R6/2 model is therefore a validated and predictive animal model for preclinical efficacy studies.
Htt Aggregation and Brain Atrophy
Increased levels of aggregated Htt can be detected by mEM48 antibody at symptomatic ages in 120 CAG R6/2 mice. Aggregation of mutant huntingtin is accompanied by a decrease in the percentage of striatal DARPP-32-positive medium spiny neurons and a significant atrophy of both the dorsal striatum and the entire cerebral cortex.

Figure 1: Huntingtin aggregation in striatal tissue from 120 CAG R6/2, at ages ranging from 2 to 16 weeks. Htt aggregation in R6/2 occurs in an age-dependent manner.
Figure 2A: mEM48
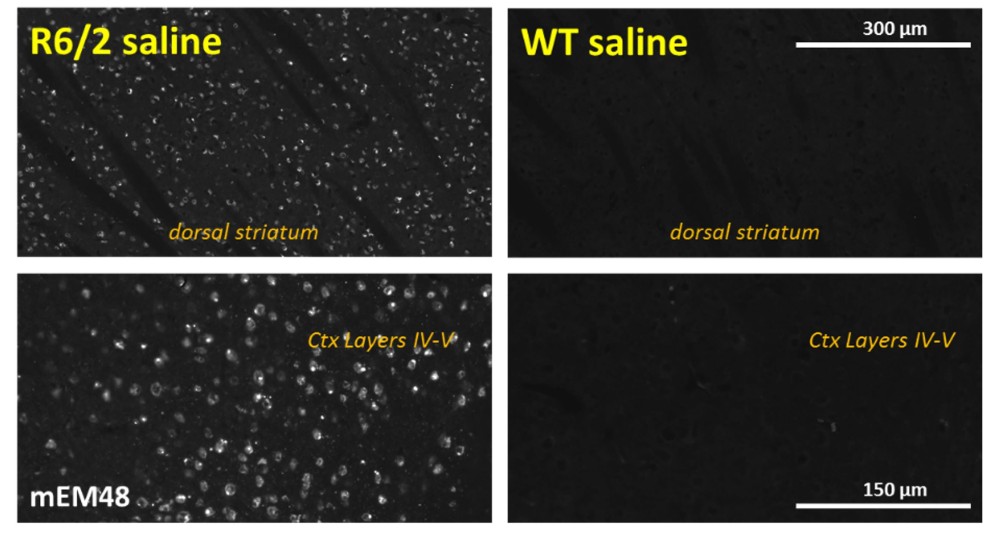
Figure 2B: Total Htt
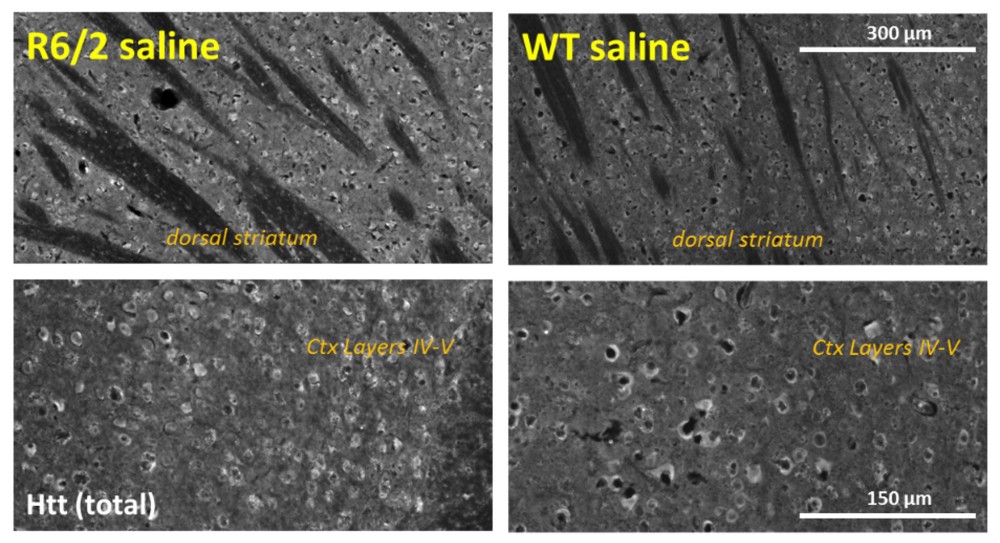
Figure 2C: DARPP-32
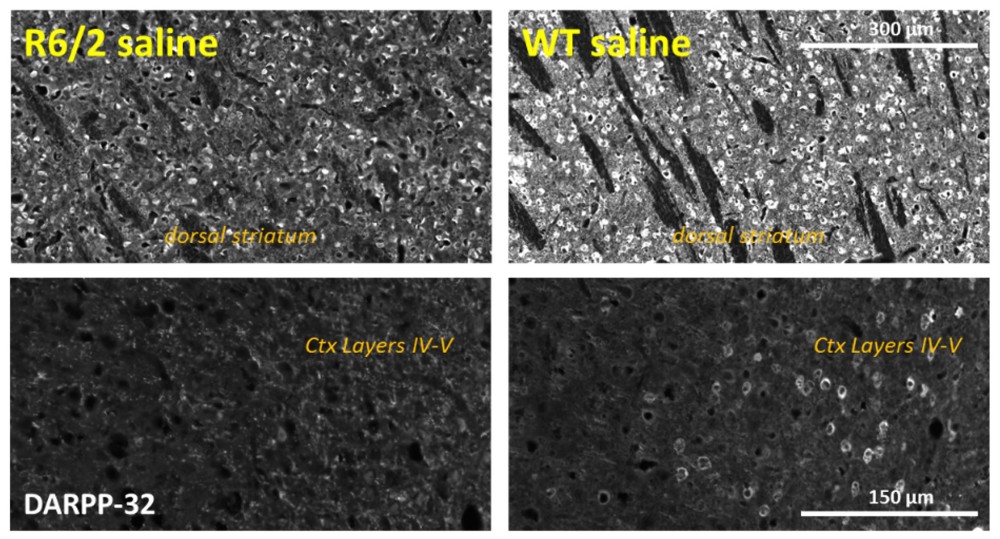
Figures 2A – 2C: (A) Nuclear accumulation of Htt aggregates, labeled by mEM48 antibody, in medium spiny and cortical neurons of 12-week-old 120 CAG R6/2 mice. Note the absence of Htt aggregates in WT mice. (B) The level of total Htt protein, detected by LS-C204217 antibody, is also increased in the 120 CAG R6/2 mice as compared to WT. (C) 120 CAG R6/2 shows a loss of striatal medium spiny neurons as well as a general loss of DARPP-32-positive neuropil labeling in striatum. DARPP-32 positive neurons in deep cortical layers are also widely absent in 120 CAG R6/2 mice.

Figure 3A-C: Histological quantification of (A) mEM48, (B) DARPP-32 and (C) atrophy in the dorsal striatum (Left) and the cerebral cortex (Right) of R6/2 versus WT. 120 CAG R6/2 mice at the age of 12 weeks show a strong increase of mEM48 positive aggregates, a loss of MSN as judged by reduction of DARPP-32 labeling. They also demonstrate a severe atrophy of the dorsal striatum and cerebral cortex.
Behavioral Assessment
120 CAG R6/2 mice, show a progressive decline in motor function (around 6 weeks of age), loss of body weight (around 10 weeks of age), and premature death.
Reduced Survival Rate in 120 CAG R6/2 Mice
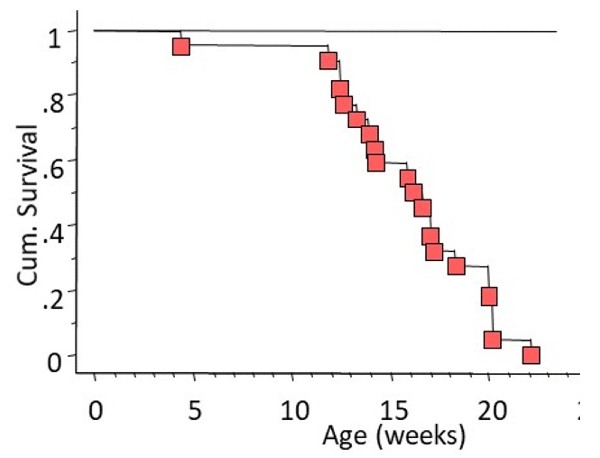
Figure 4: Kaplan-Meier survival analysis showing the declining survival rate from birth to 25 weeks of age. The survival rate at 16 weeks of age is 50%. None of the 120 CAG R6/2 mice survive past 23 weeks of age.
120 CAG R6/2 Mice Are Lighter Than WT Littermates
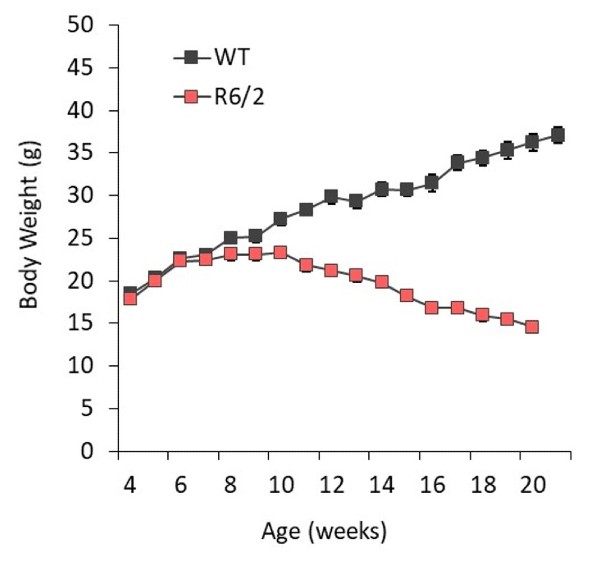
Figure 5: Body weight curve from 4 to 22 weeks indicates that 120 CAG R6/2 mice start to lose body weight at 10 weeks of age.
120 CAG R6/2 Mice Have Reduced Ambulatory Activity
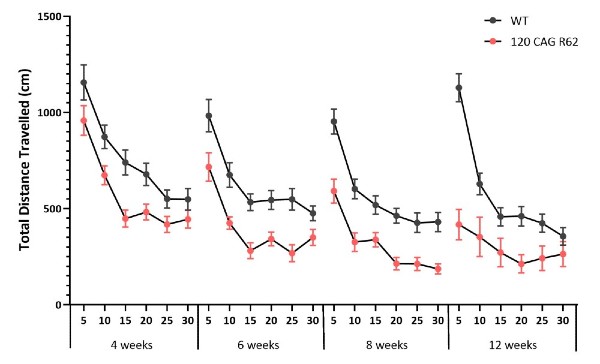
Figure 6: Total distance traveled in open field chambers. Data are collected in 5-minute bins over 30 minute sessions, at 4, 6, 8 and 12 weeks of age. 120 CAG R6/2 mice display reduced total distance traveled compared to WT littermates at all ages. This reduced activity is exacerbated with aging.
120 CAG R6/2 Mice Display Four Limb Clasping
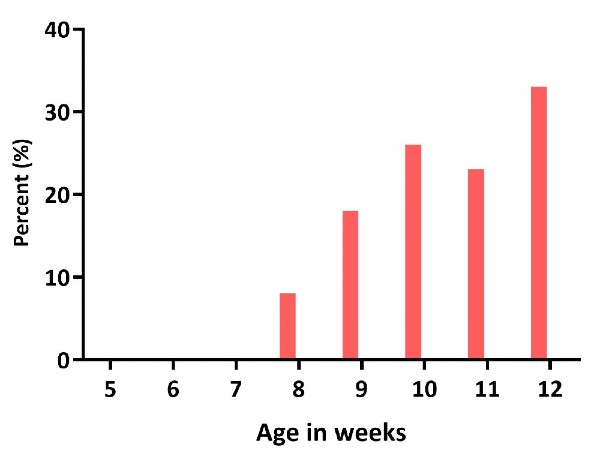
Figure 7: Percentage of 120 CAG R6/2mice displaying four limb clasping from 5 to 12 weeks of age. 120 CAG R6/2 mice display full clasping starting at 8 weeks of age and worsening with age progression. This neurological response is absent in age-matched WT littermates.
120 CAG R6/2 Mice Exhibit Loss of Motor Coordination
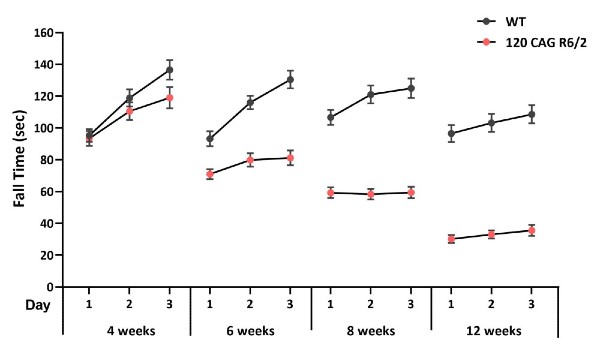
Figure 8: Latency to fall collected from 3 consecutive trials at 4, 6, 8 and 12 weeks of age. 120 CAG R6/2 mice demonstrated a loss of motor coordination as early as 6 weeks of age, with a faster latency to fall when compared to their WT littermates.
Progressive Downregulation of Striatal mRNA Transcripts
The 120 CAG R6/2 mouse model shows a progressive striatal neurodegeneration, recapitulating changes observed in human Huntington’s disease brains. Expression of medium spiny neuron transcript markers (Drd1, DARPP32, DrD2, Pde10A and Cnr1) are downregulated in R6/2, in an age-dependent manner.
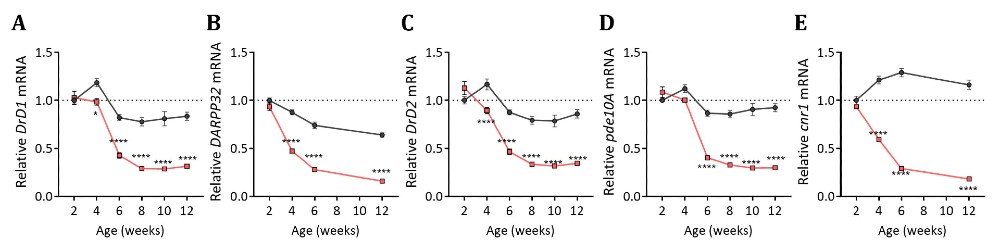
Figure 9: Quantitative PCR (qPCR) analysis of striatal tissue from 120 CAG R6/2 mice from 2 to 12 weeks of age (WT in gray; R6/2 in red). Relative level of target genes, Drd1=D1 receptor (A), Darpp32 (B), Drd2=D2 receptor (C), Pde10a=cGMP phosphodiesterase 10A (D), and Cnr1=cannabinoid receptor 1 (E), are first normalized to the geometric mean of three housekeeping genes (Gapdh, ATP5b, Elf4a2) and then are normalized to the average levels of mRNA expression levels seen in 2-week-old WT mice (n=24 for 6-week-old mice; n=12-24 for other ages).
Neurofilament Light Chain Protein (NfL) Levels in Plasma and CSF of 5, 8, 10 and 12-Week-Old 120 CAG R6/2 Mice

Figure 10: Starting at 8 weeks of age the concentration of NfL, a biomarker of neuronal damage, in both plasma (A) and CSF (B) is significantly increased in R6/2 CAG 120 mice. Age-dependent effects were determined by comparing NfL concentration of each age group to that of the youngest genotype-matched cohort: *, p<0.05; **, p<0.01, #, p<0.001; ##, p<0.0001. Genotype-dependent effects were determined by comparing R6/2 CAG 120 data at each age to that of age-matched WT: ^, p<0.05; ^^, p<0.01, $, p<0.001; $$, p<0.0001.
Hyperexcitability in Dorsal Striatal Medium Spiny Neurons (MSNs) in 120 CAG R6/2 Mice
Medium spiny neurons (MSN) within the striatum, have been the most extensively studied cell type in HD mouse models. Ex vivo electrophysiological recordings of MSNs from acutely prepared slices using whole-cell patch clamp techniques, show an age dependent hyperexcitability phenotype and deficits in synaptic transmission. Somatic recordings indicate that cells become depolarized, exhibit reduced rheobase in response to current injection, and exhibit significantly higher membrane resistance around resting state (see figure 11; left panel), implying the loss of hyperpolarizing conductance that maintains MSN quiescence. Additionally, the frequency of miniature excitatory synaptic potentials (mEPSC) recorded in MSNs is significantly reduced, suggesting weakening or loss of cortical input (right panel).
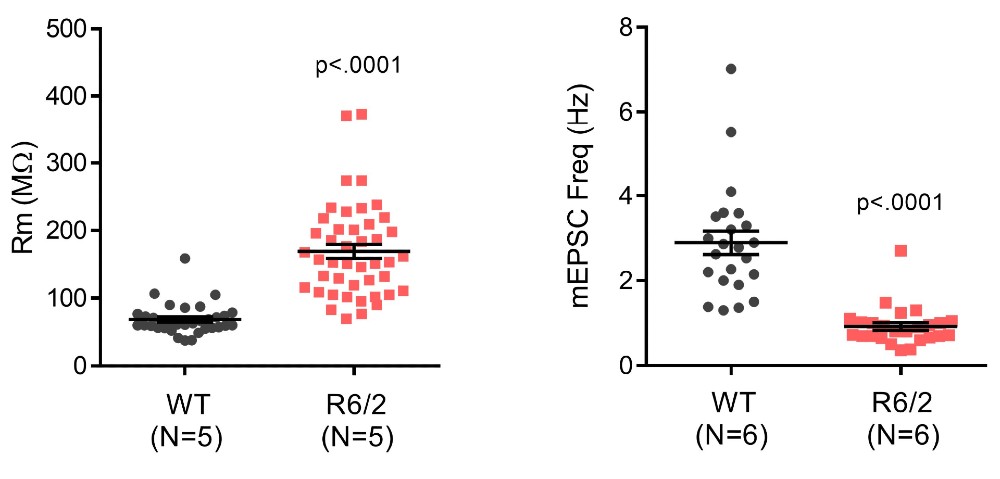
Figure 11: Striatal MSNs from 8 to 12-week-old R6/2 120 CAG mice exhibit elevated input resistance (Rm, A) and reduced frequency of spontaneous excitatory post-synaptic currents (mEPSCs, B). The amplitude of mEPSCs was unaffected (not shown). These readouts are consistent with both intrinsic hyper-excitability and the loss of excitatory synapses. Animal numbers are indicated in parentheses.
Alterations of Kynurenine Pathway Metabolites in the Striatum of 12 to 13-Week-Old 120 CAG R6/2 Mice
Comparison of striatal levels of kynurenine metabolites in 12 to 13-week-old 120 CAG R6/2 to wild type mice demonstrate a significant increase in the neurotoxic metabolite 3-hydroxykynurenine levels in R6/2 mice. This neurotoxin is believed to play a causative role in HD. Such changes in kynurenine metabolism are associated with neuroinflammation and have been demonstrated to be involved in other CNS-related disorders such as Parkinson’s, Alzheimer’s, depression, schizophrenia and ALS. In particular, increased levels of quinolinic acid has been associated with suicidality in humans. Thus, measuring changes in kynurenine metabolites not only provides surrogate biomarkers of disease progression, but can also be used in efficacy studies and PK/PD readouts.
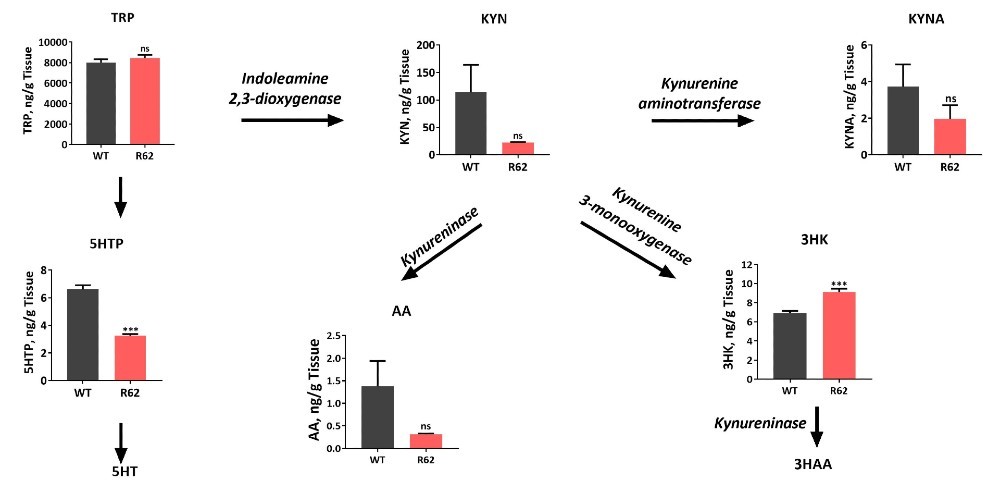
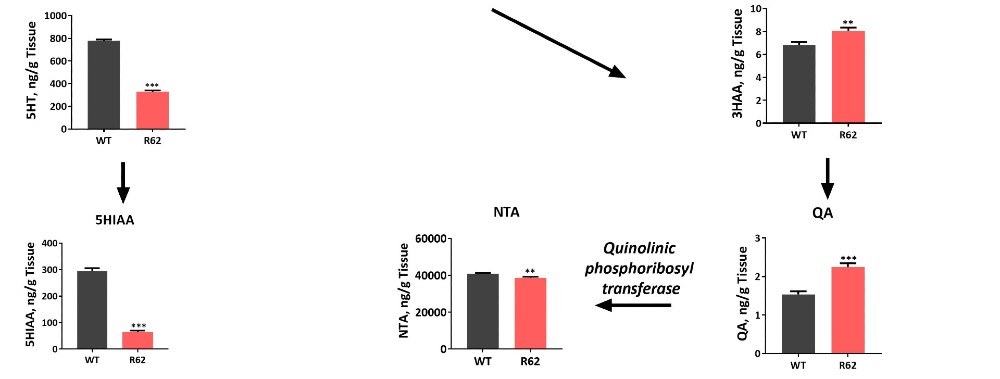
Figure 12: LC/MS/MS was used to measure Kynurenine and related analytes in striatal tissue of the 120 CAG R6/2 vs. wild type mice. Neuroactive metabolites of the kynurenine pathway have been implicated in the pathophysiology of neurodegenerative disorders, including HD. Significant changes were observed in these important neurochemicals in the 12 to 13-week-old 120 CAG R6/2 mice.
To obtain a complete review of 120 CAG R6/2 phenotyping and other models of Huntington’s disease, please consult our additional resources:
https://www.staging.psychogenics.com/services/huntington%e2%80%b2s-disease/
https://chdifoundation.org/a-field-guide-to-working-with-mouse-models-of-huntingtons-disease.